Open Source Activity Map | Open Source Environment Map
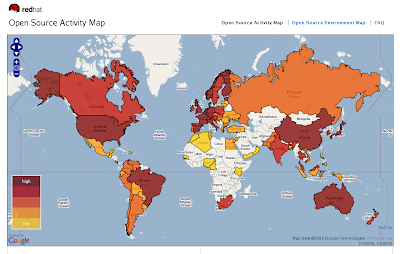
About this Map Explore open source software hotspots around the world through the interactive Open Source Index, or OSI, based on research by the Georgia Institute of Technology (Georgia Tech). The OSI is a measure of the open source activity and environment in 75 countries. Each country is given a score based on its policies, practices, and other data in the fields of Government, Industry, and Community. Click on a country to see the country's rank (1 being the highest, 75 being the lowest) in open source activity. One map shows Activity, which measures the amount of open source happening today. It tends to be made up of concrete factors, such as existing open source and open standards policies and number of OSS users, such as Linux and Google. You can also see an Environmental map, which is more speculative. Even a country that does not have a high degree of current penetration of open source may have a high number of internet users and information technology patents. These factors may indicate a favorable environment for open source software to take hold. About the Popups When you click on a country, you can see its overall rank among the 75 countries in the index, as well as its rank for Government, Industry, and Community factors. Government factors include open source procurement policies and support for open source. Industry factors include the number of registered OSS users per capita and internet growth. Community factors include the number of applications to the Google summer of code, native language support for GNU/Linux, and number of Internet users per capita. We encourage you to explore, learn, then improve or build off the Open Source Index. This work is a resource and just the beginning. Analyze the results here or gather the data and change the construction. Whatever you do, share it with the rest of us. Source: http://www.redhat.com/about/where-is-open-source/activity/
|
No comments:
Post a Comment